SPOTIFY MUSIC & MOOD

HCI research on supporting self reflection through a visual understanding of the relationship between personal music listening history and mood

As part of Professor Brian Smith’s Human Computer Interaction at Columbia University, I designed a research project and published a paper around understanding the relationship between personal music listening history and mood.


TEAM

Sharon Jia, Emily Li, Karen Lin

TIMELINE

2 months

MY ROLE

Research Design, User Testing, Built Data Visualization Using d

TOOLS

Observable, Github, Overleaf

OVERVIEW

How can we enable users to make sense of the relationship between their personal music listening history and mood? How can we use this understanding able to better support experiences of self-reflection for users?

Our paper makes two contributions to HCI. First, we leverage personal music listening history as a new data source to passively and indirectly reveal measures of mood. Second, we design data visualizations to display both the music listening histories and predictions in an interactive manner, enabling users to have more agency in the process of reflecting and understanding their own mood.

OUR CONTRIBUTION

First, we leverage personal music listening history as a new data source to passively and indirectly reveal measures of mood. Second, we design data visualizations to display both the music listening histories and predictions in an interactive manner, enabling users to have more agency in the process of reflecting and understanding their own mood.

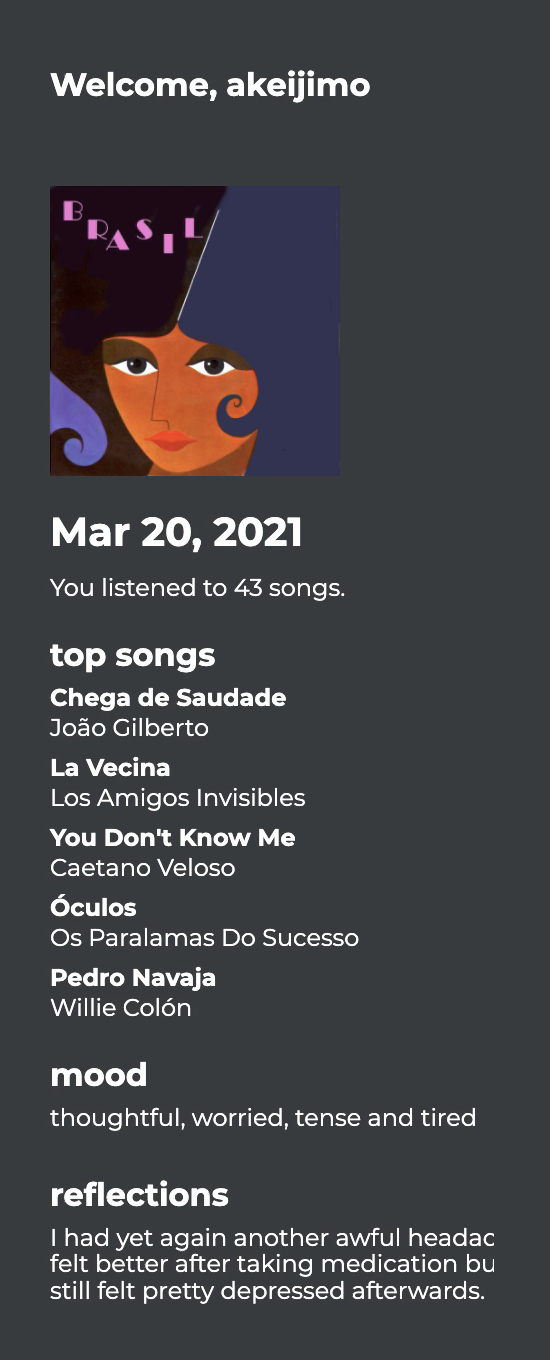
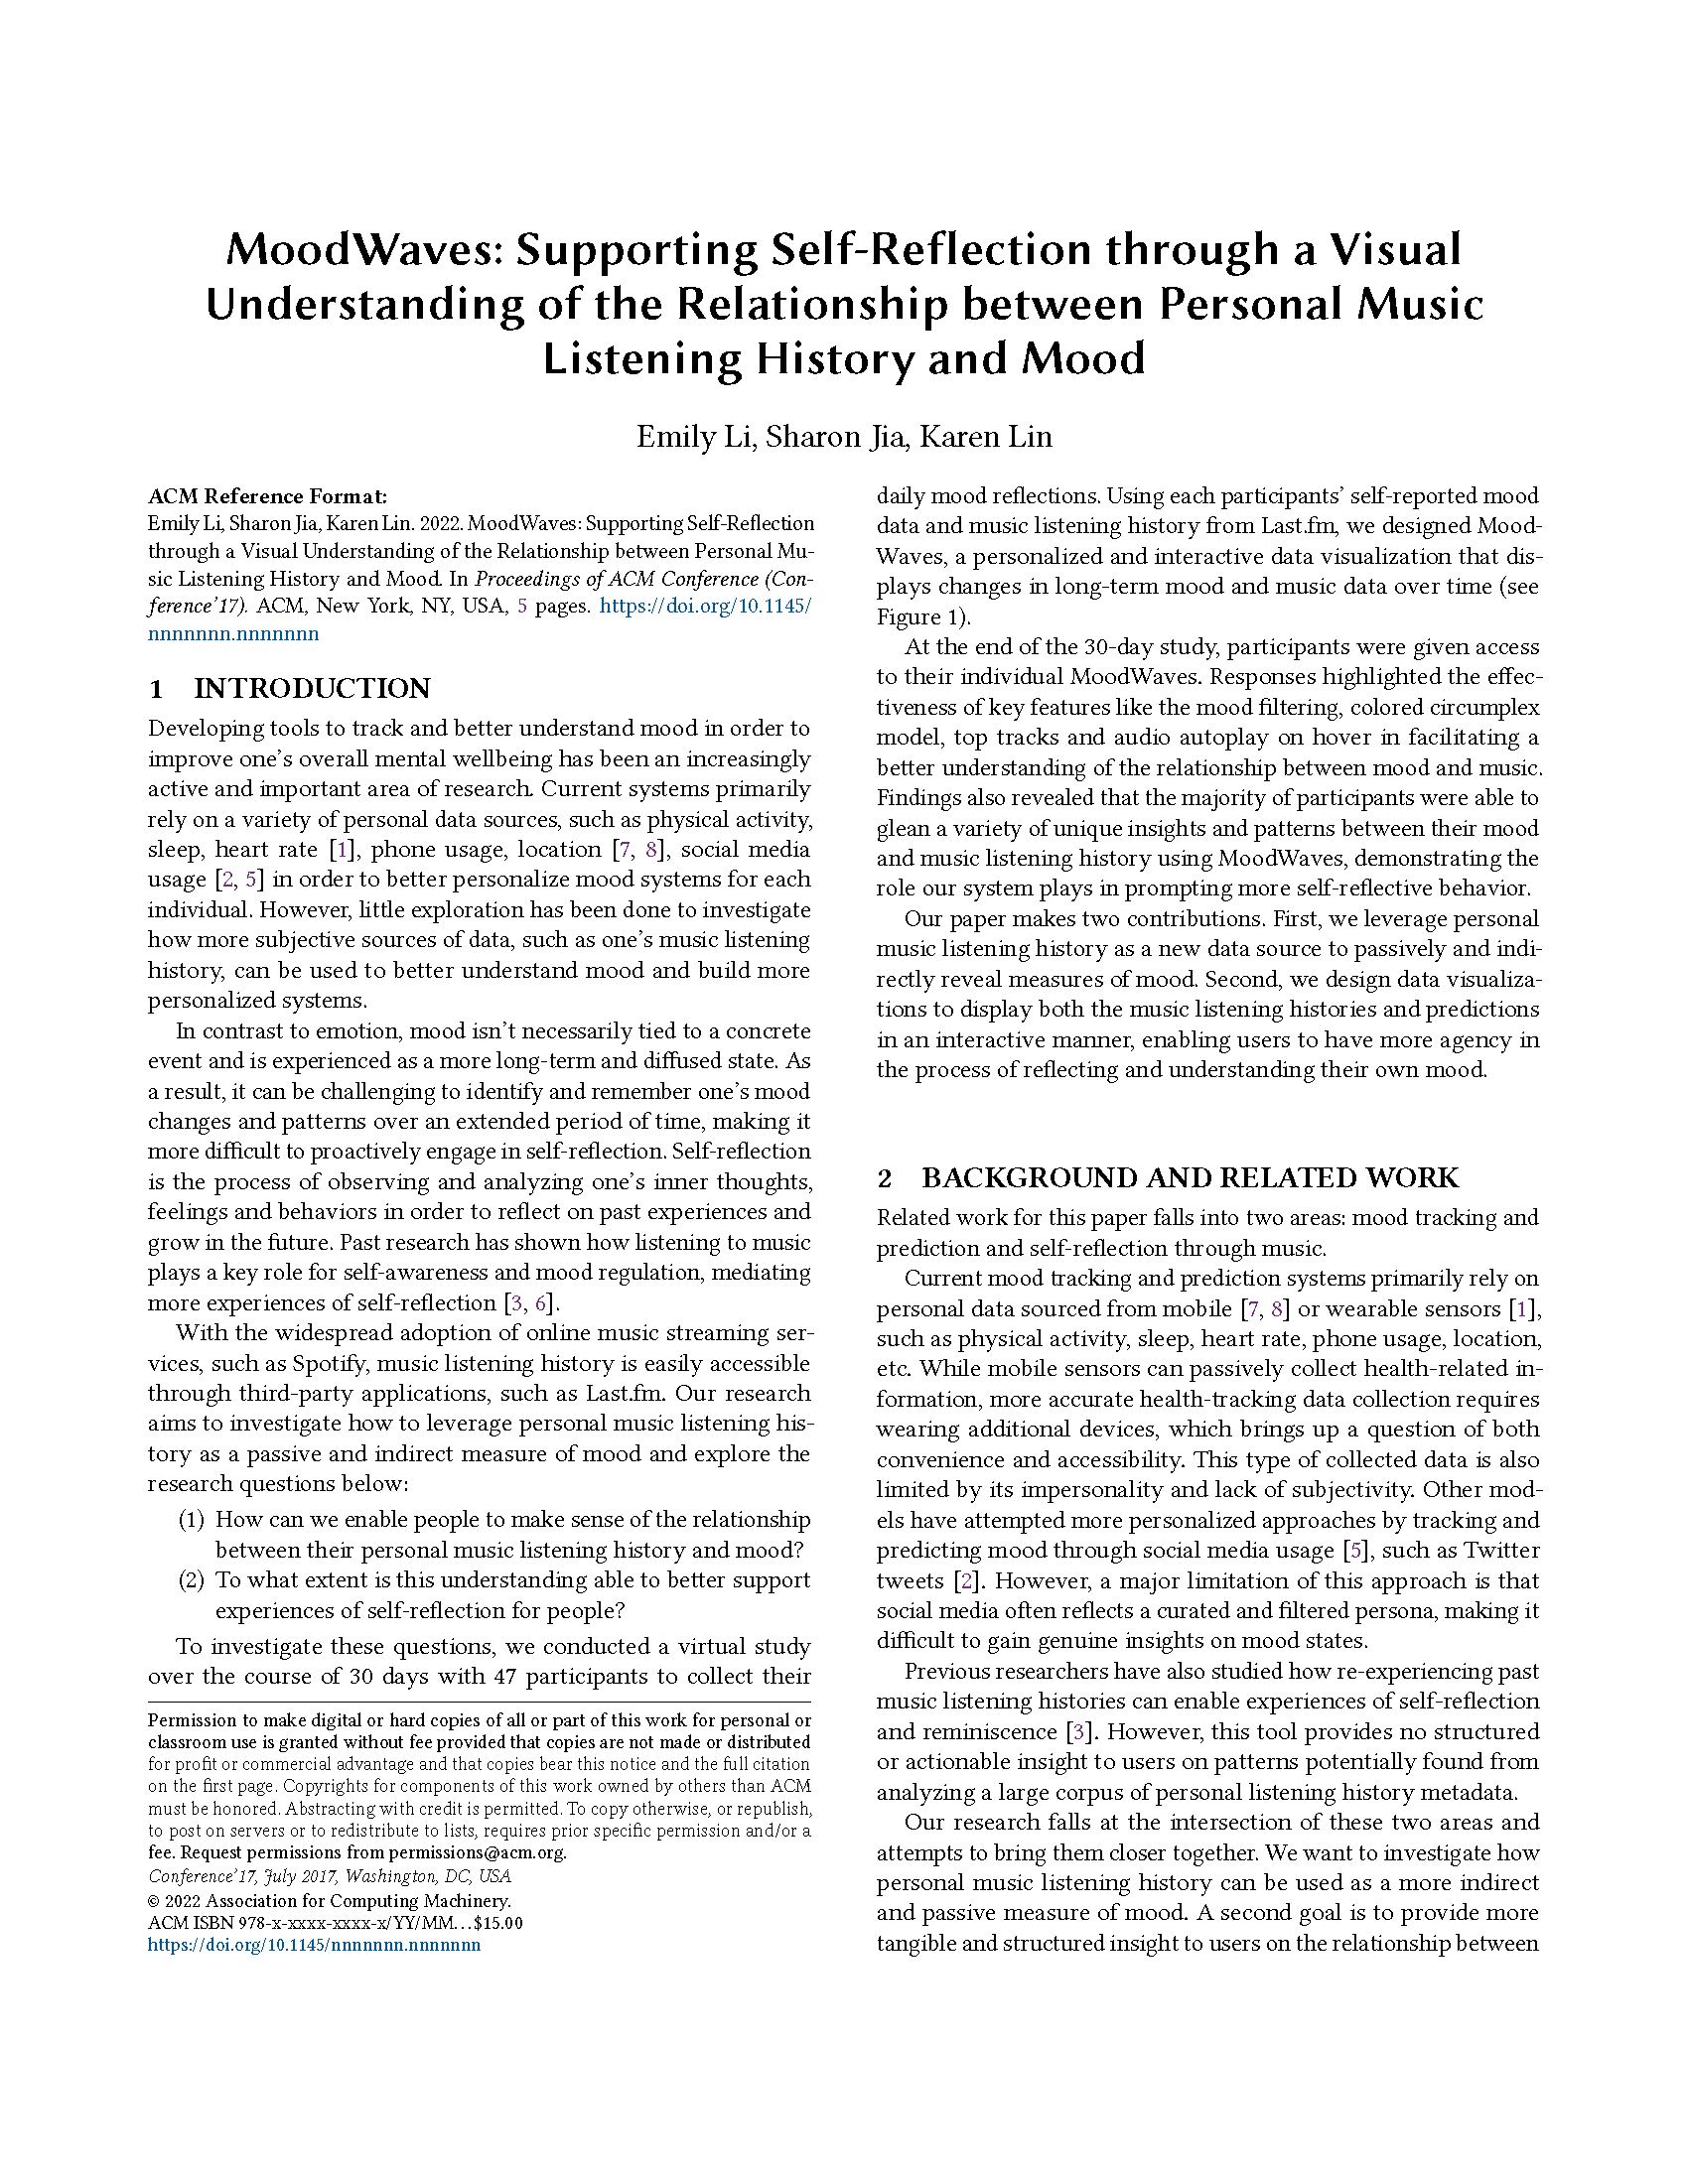
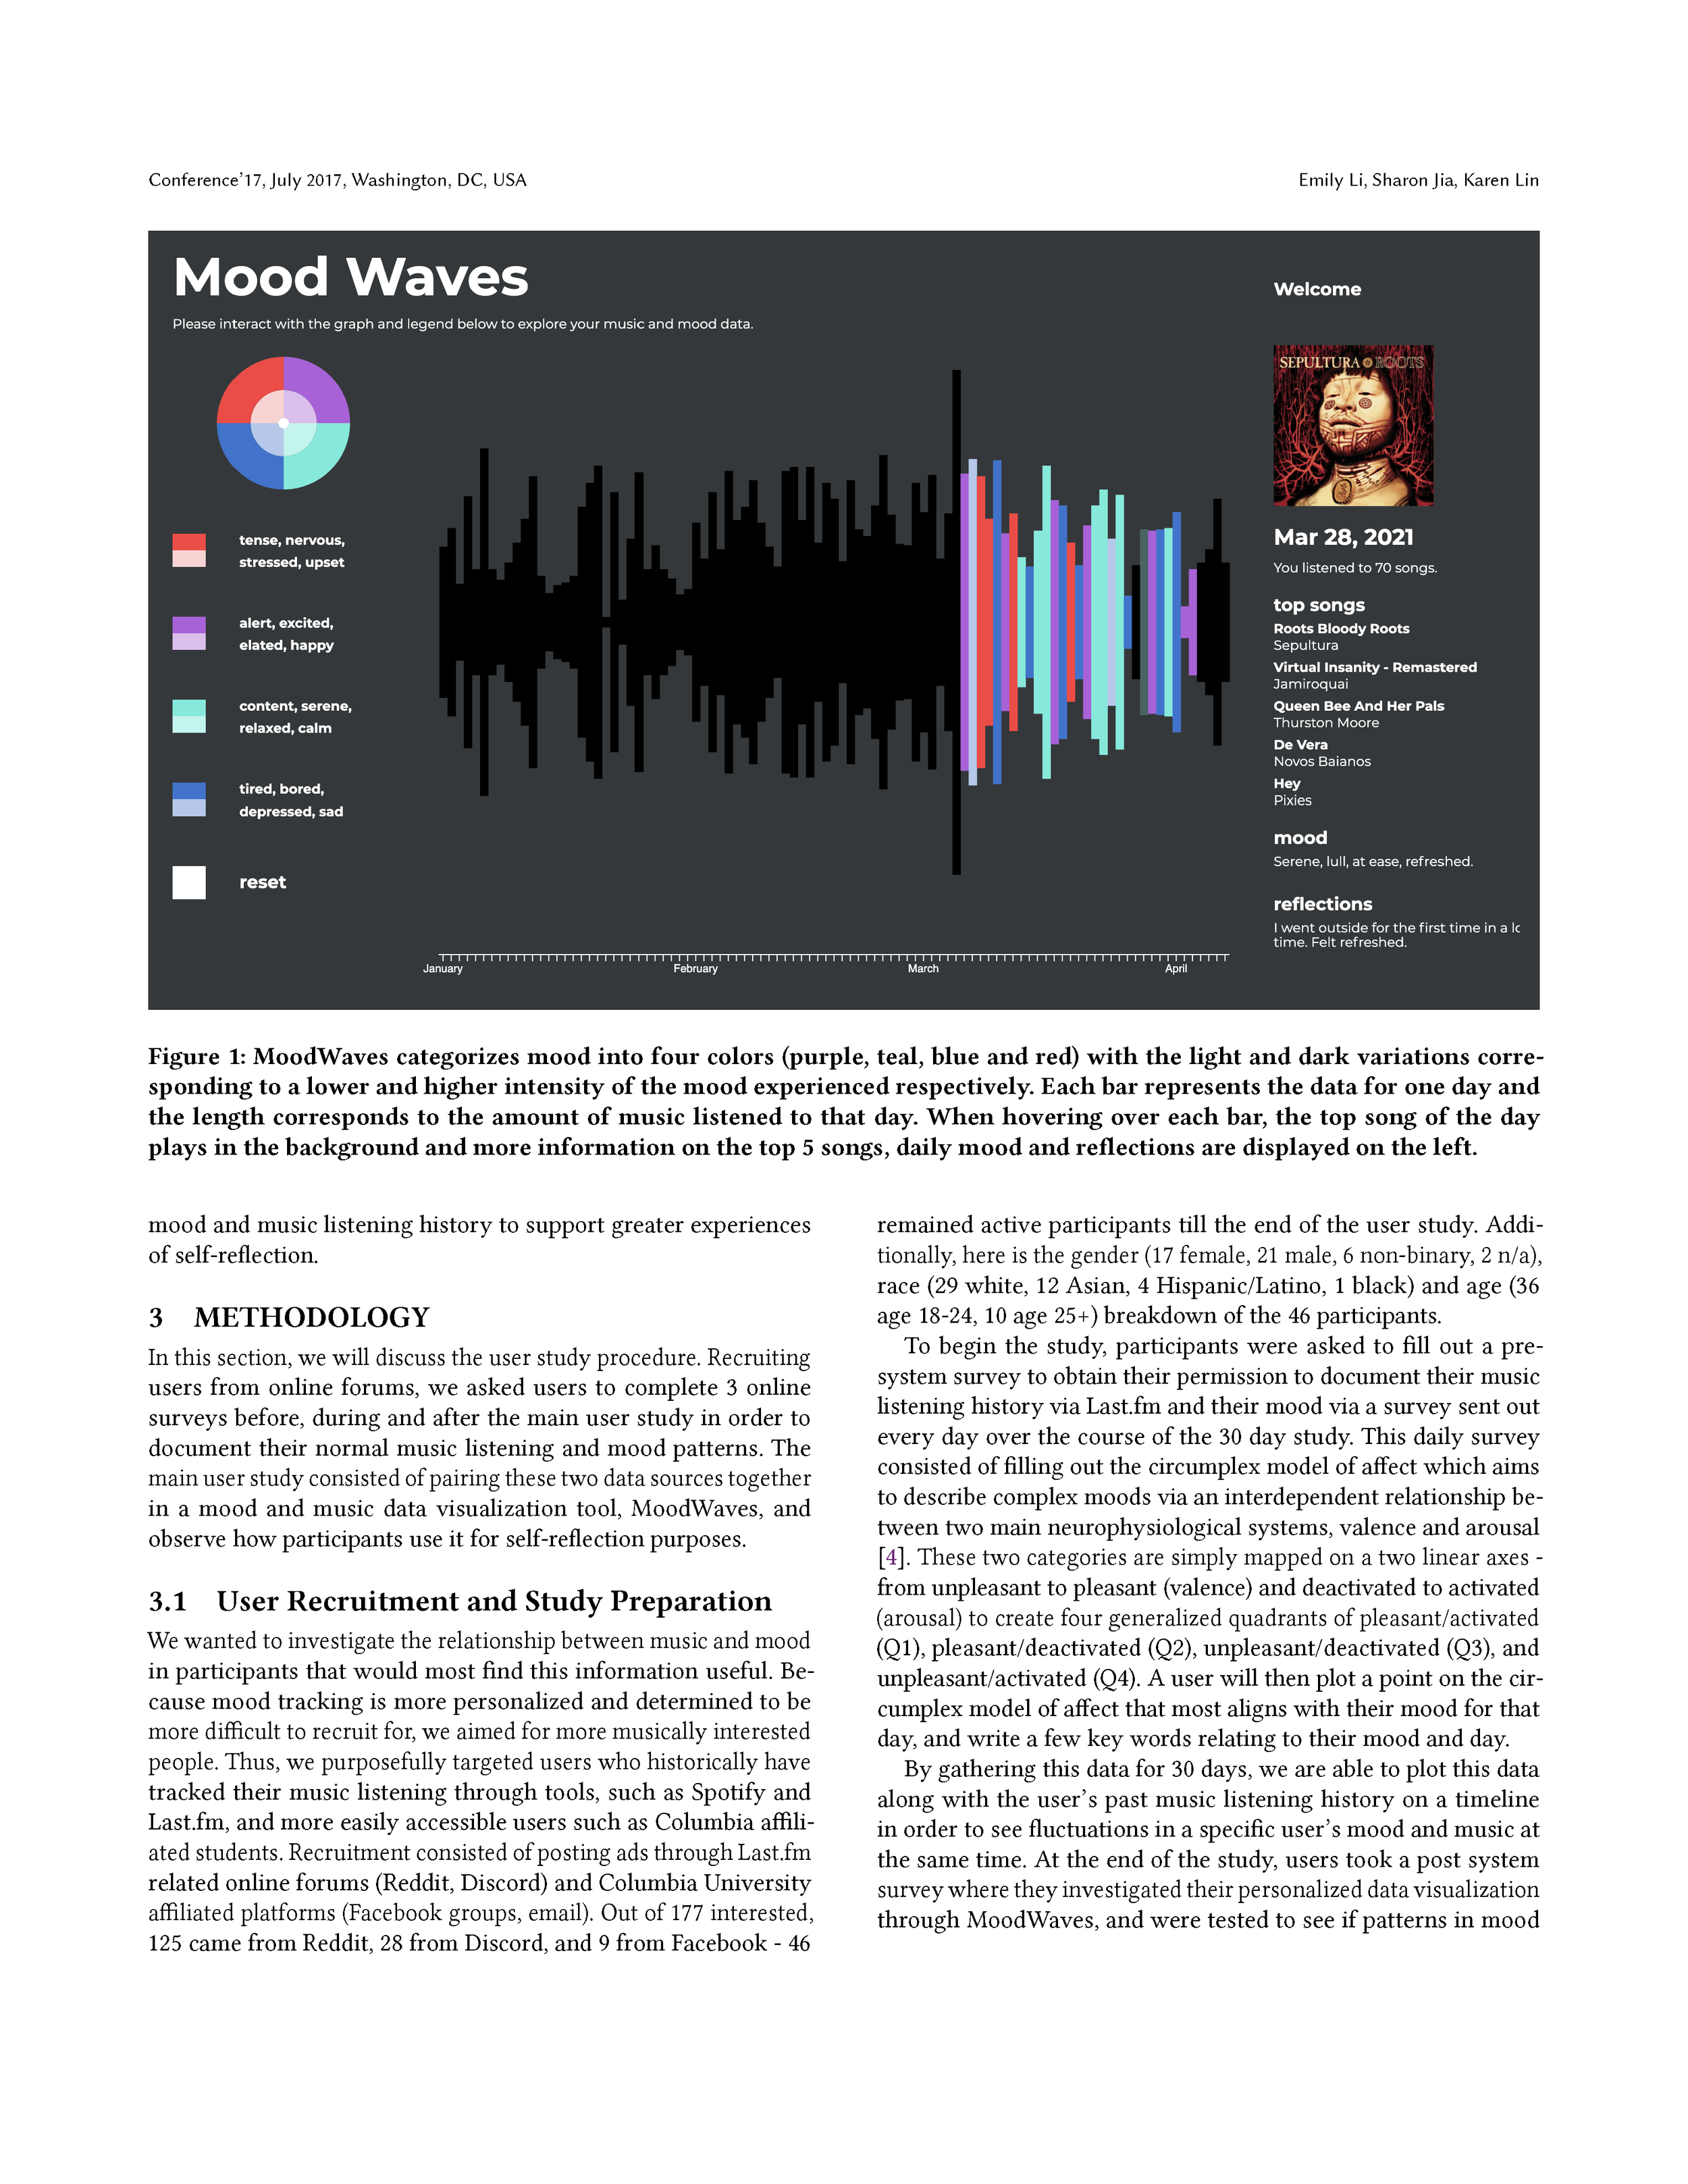
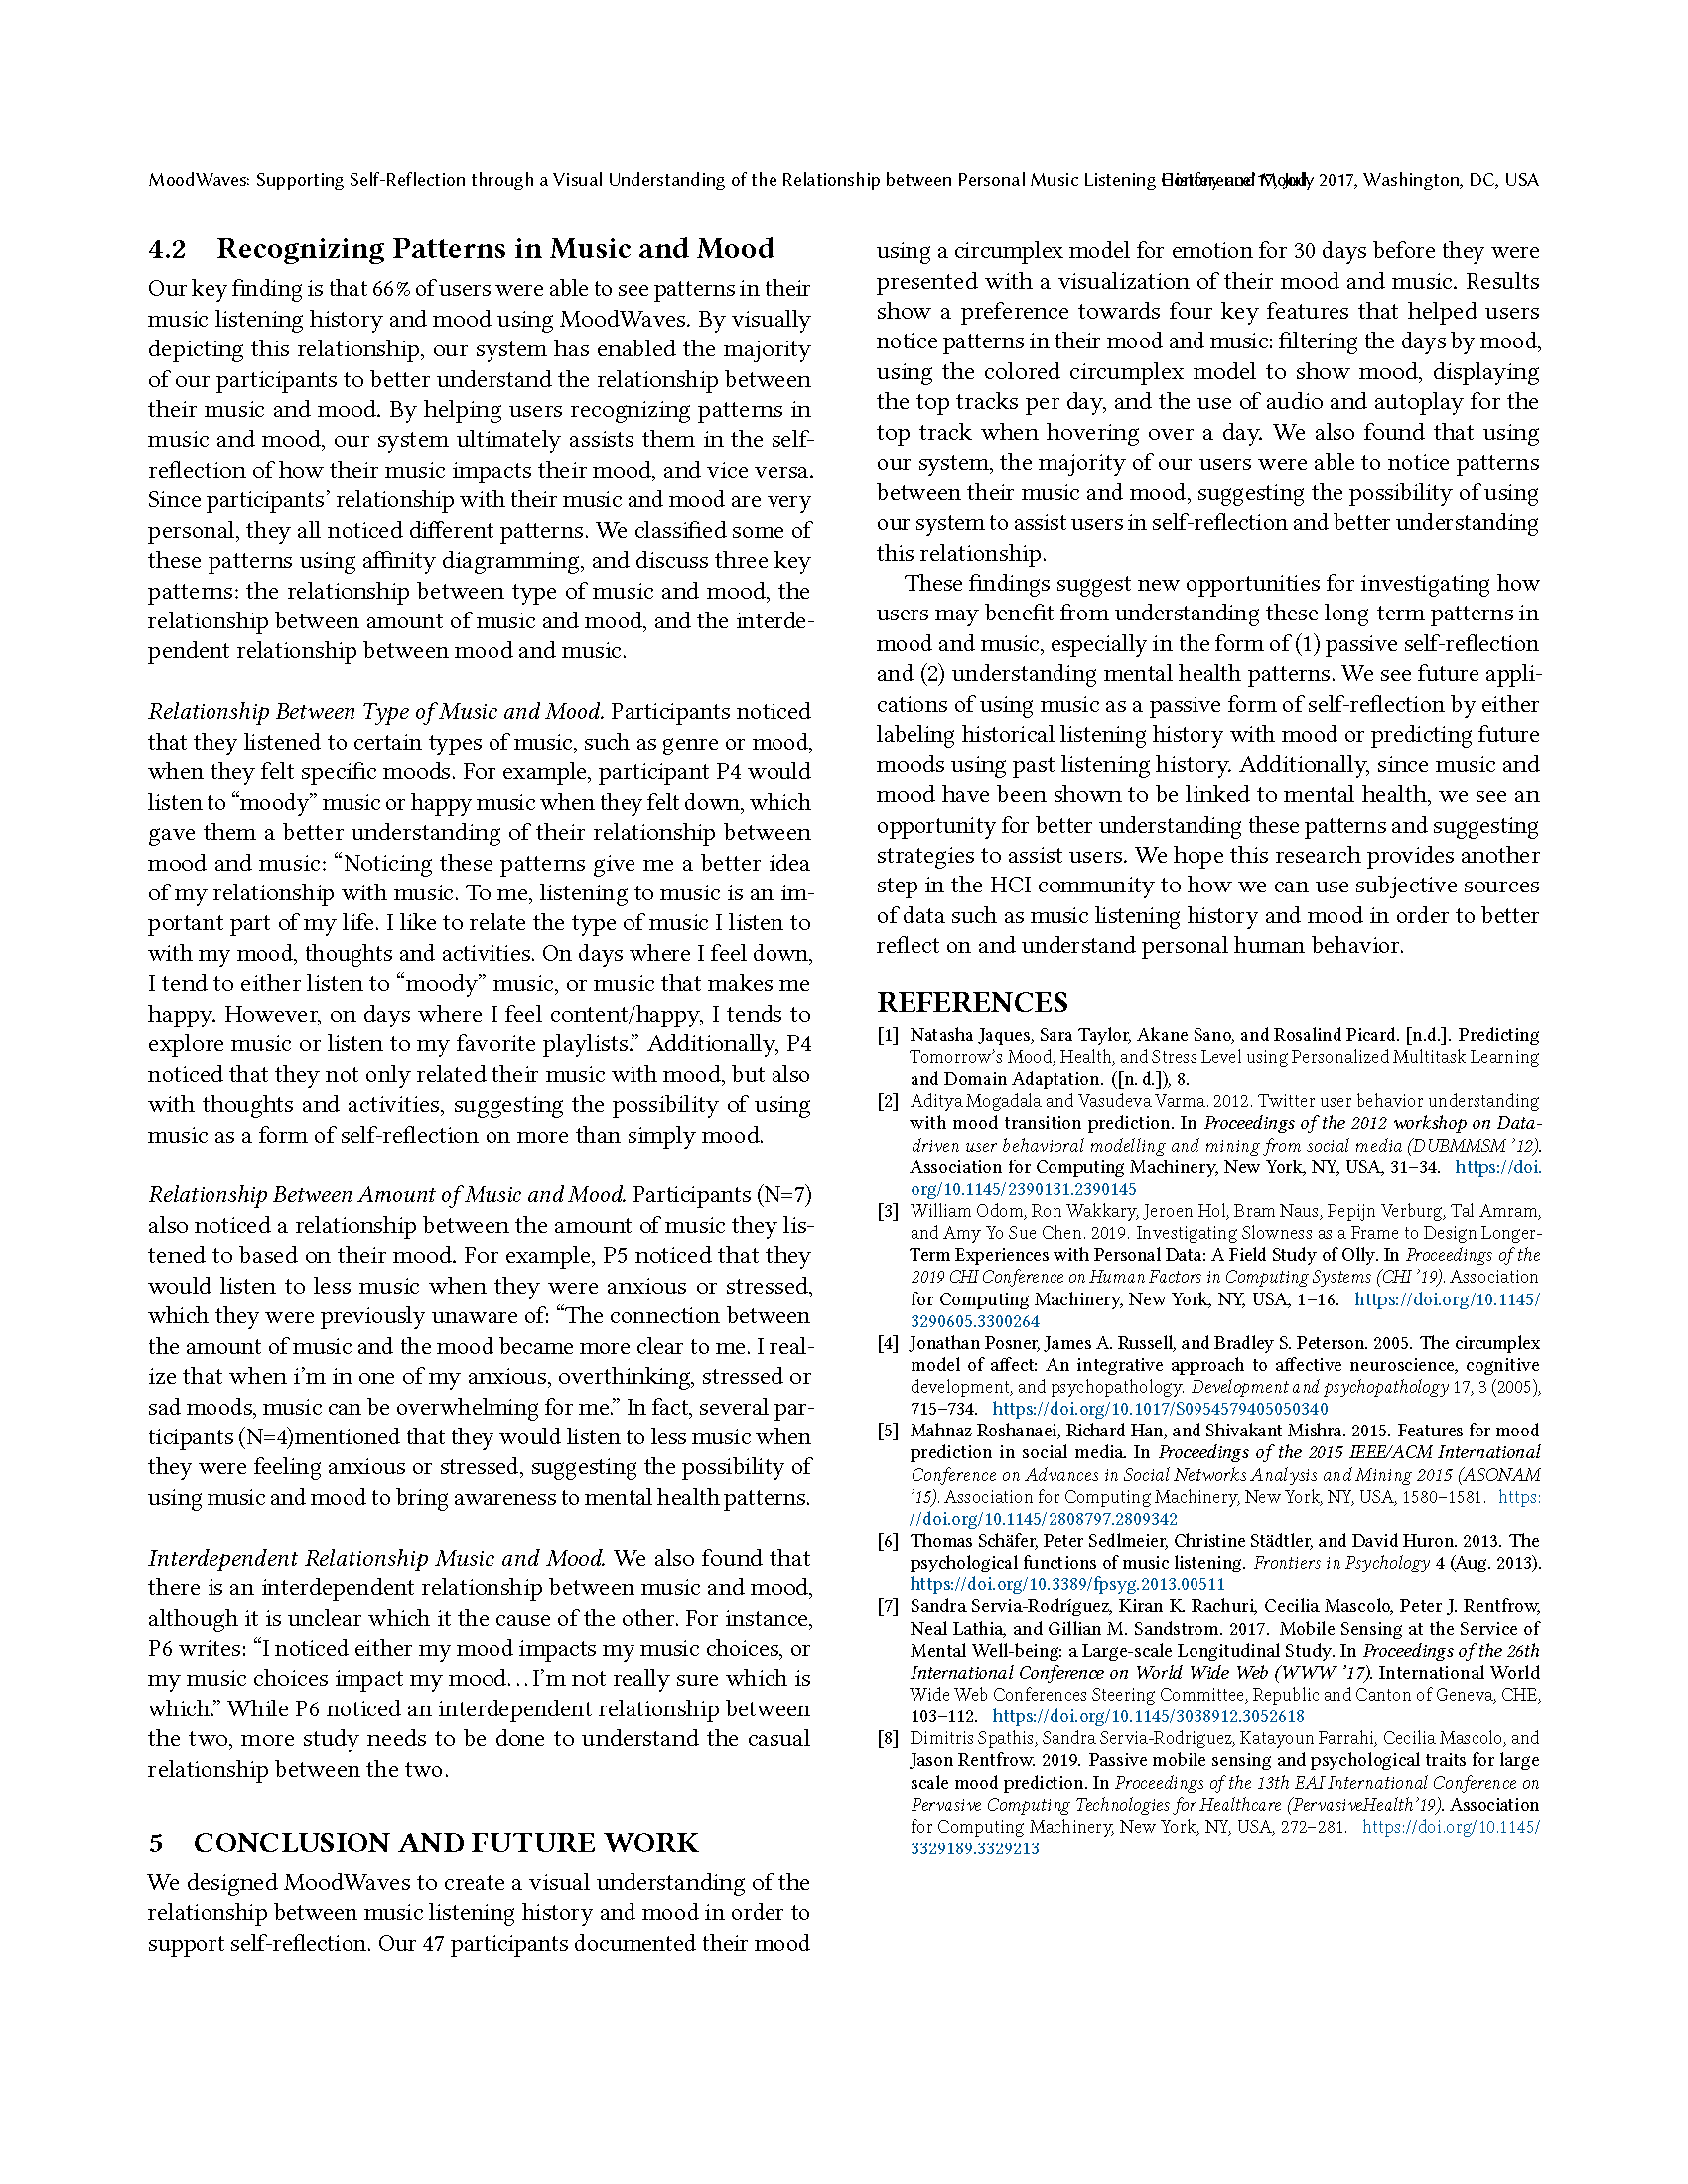
To investigate our research questions, we conducted a virtual study over the course of 30 days with 47 participants to collect their daily mood reflections. Using each participants’ self-reported mood data and music listening history from Last.fm, we designed MoodWaves, a personalized and interactive data visualization that displays changes in long-term mood and music data over time. At the end of the 30-day study, participants were given access to their individual MoodWaves.

FINDINGS

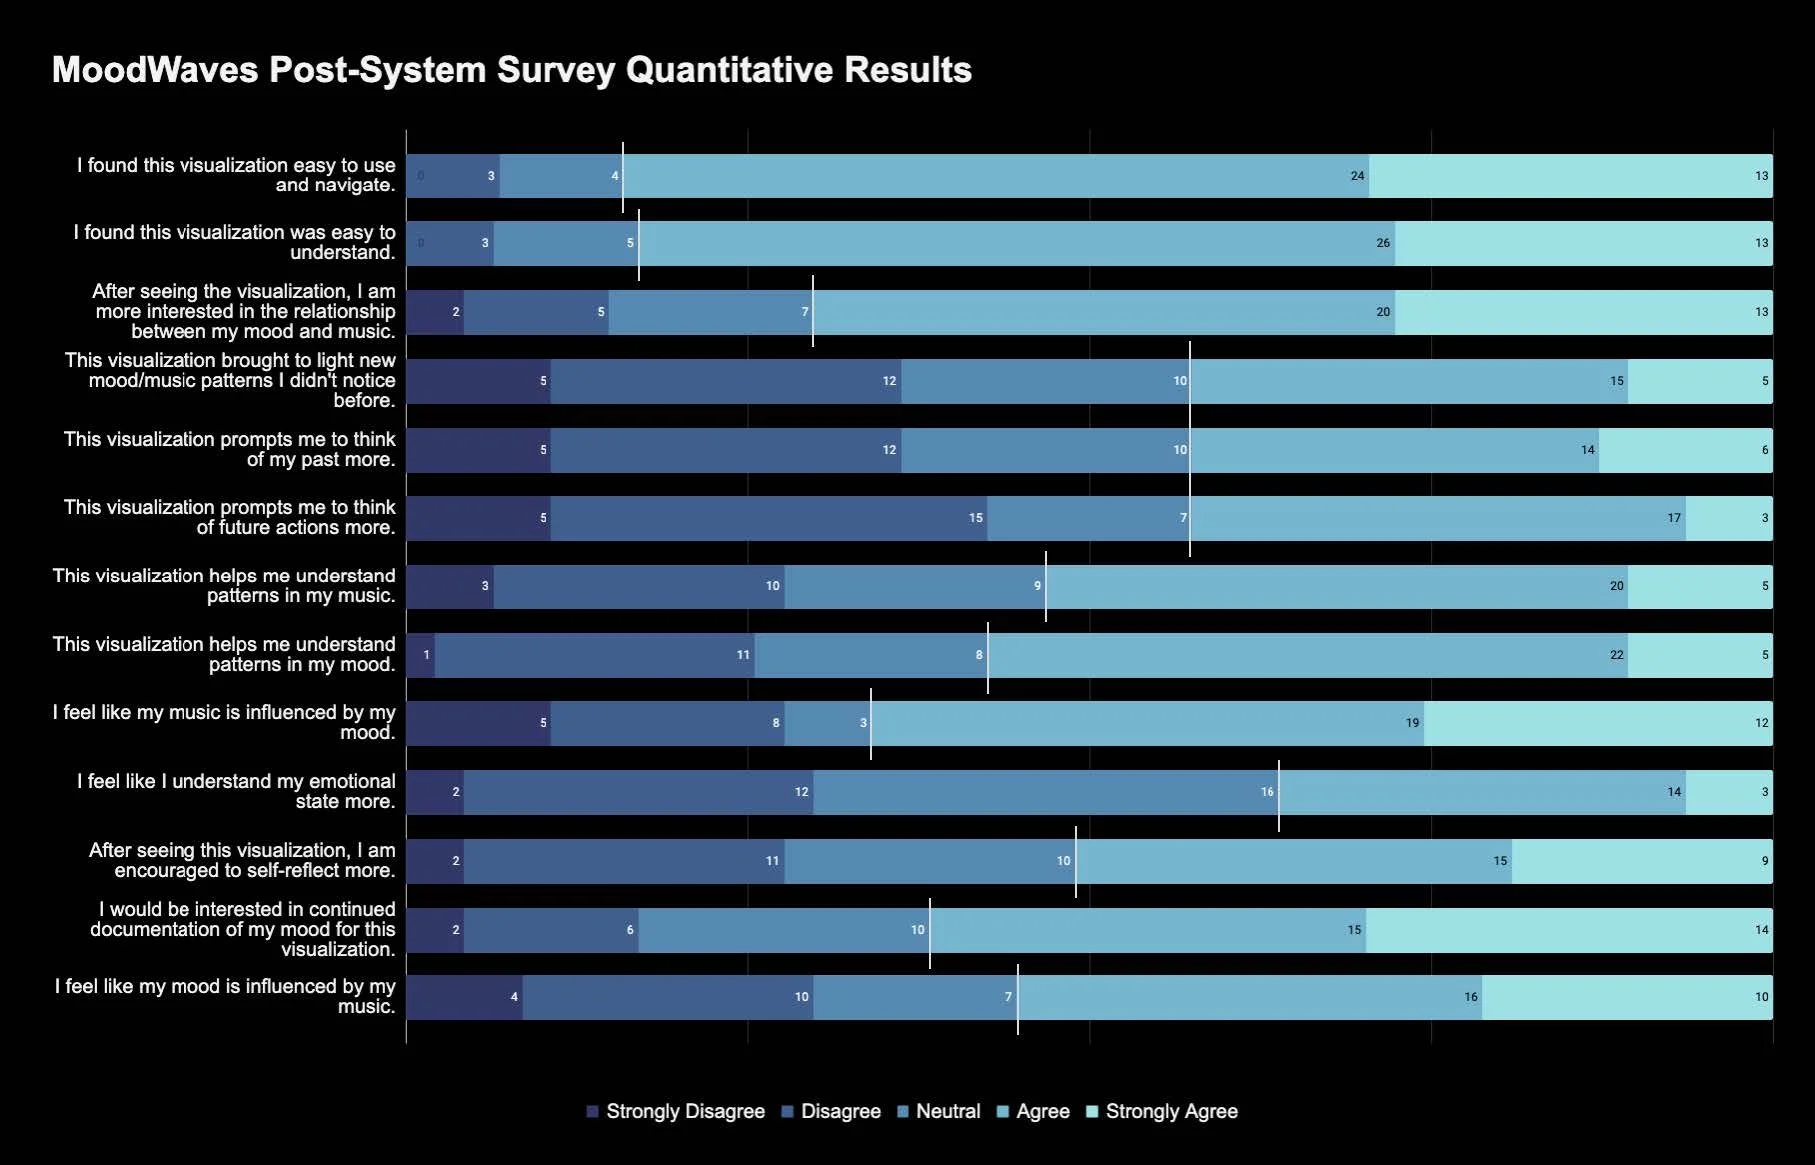
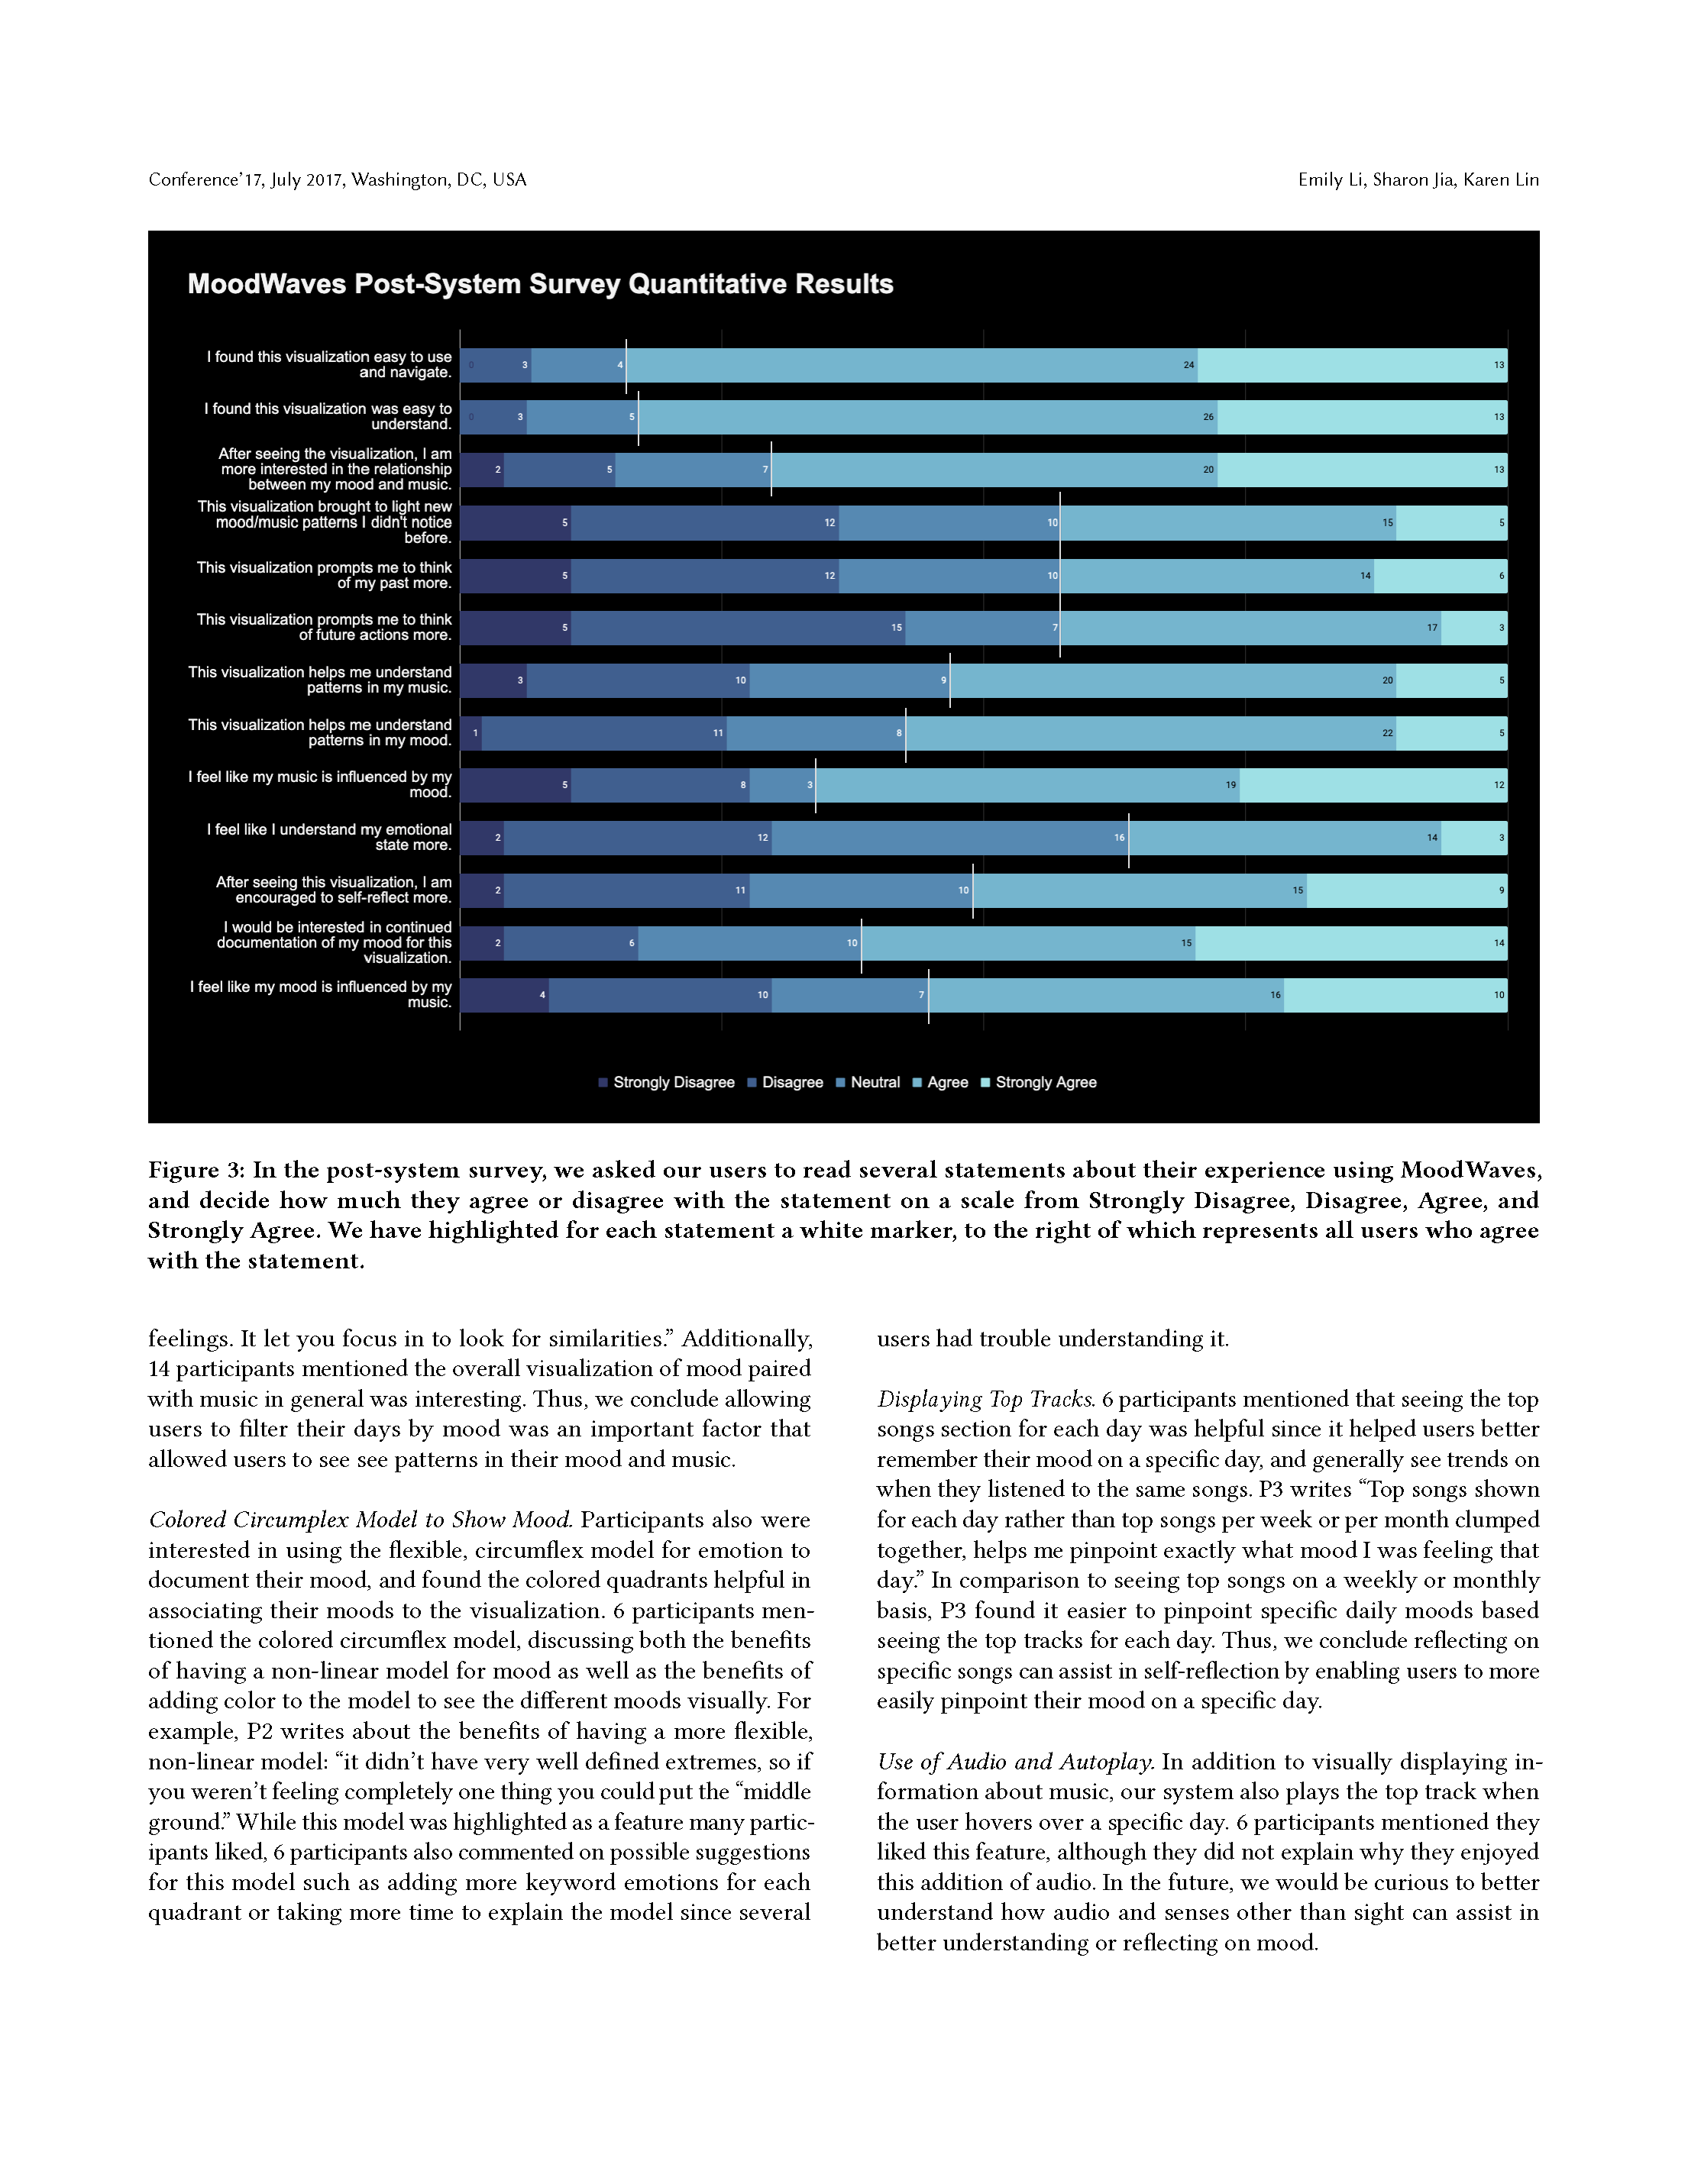
66% of users noticed patterns in their mood and music listening history using MoodWaves.

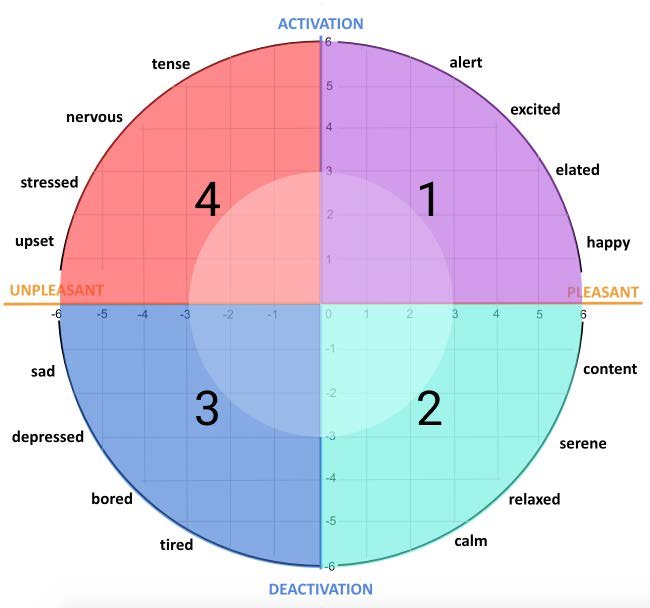
Findings revealed that the majority of participants were able to glean a variety of unique insights and patterns between their mood and music listening history using MoodWaves, demonstrating the role our system plays in prompting more self-reflective behavior. Since participants’ relationship with their music and mood are very personal, they all noticed different patterns. We classified some of these patterns using affinity diagramming, and will discuss three key patterns: the relationship between (1) type of music and mood, (2) the relationship between amount of music and mood, and (3) the interdependent relationship between mood and music.

INTROUDCTION

Our research aims to investigate how to leverage personal music listening history as a passive and indirect measure of mood.

Developing tools to track and better understand mood in order to improve one’s overall mental wellbeing has been an increasingly active and important area of research. Current systems primarily rely on a variety of personal data sources, such as physical activity, sleep, heart rate, phone usage, location, social media usage in order to better personalize mood systems for each individual. However, little exploration has been done to investigate how more subjective sources of data, such as one’s music listening history, can be used to better understand mood and build more personalized systems.

In contrast to emotion, mood isn’t necessarily tied to a concrete event and is experienced as a more long-term and diffused state. As a result, it can be challenging to identify and remember one’s mood changes and patterns over an extended period of time, making it more difficult to proactively engage in self-reflection. Self-reflection is the process of observing and analyzing one’s inner thoughts, feelings and behaviors in order to reflect on past experiences and grow in the future. Past research has shown how listening to music plays a key role for self-awareness and mood regulation, mediating more experiences of self-reflection.

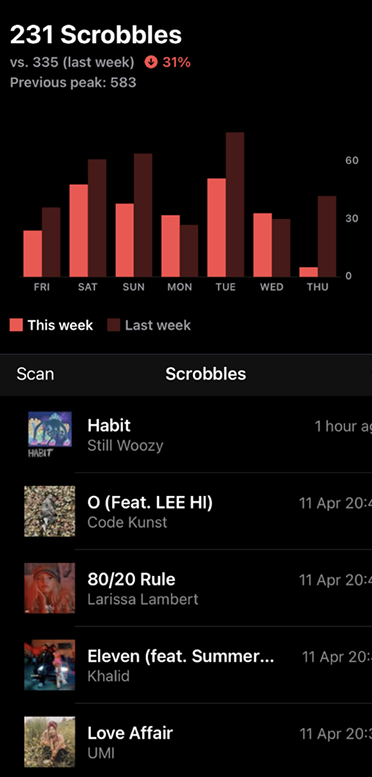
With the widespread adoption of online music streaming services, such as Spotify, music listening history is easily accessible through third-party applications, such as Last.fm. Our research aims to investigate how to leverage personal music listening history as a passive and indirect measure of mood and explore the research questions below: (1) How can we enable people to make sense of the relationship between their personal music listening history and mood? (2) To what extent is this understanding able to better support experiences of self-reflection for people?


METHODOLOGY

We recruited 76 participants and collected their survey data every day for 30 days.

Recruiting users from online forums, we asked users to complete 3 online surveys before, during and after the main user study in order to document their normal music listening and mood patterns. The main user study consisted of pairing these two data sources together in a mood and music data visualization tool, MoodWaves, and observe how participants use it for self-reflection purposes.

User Recruitment

We wanted to investigate the relationship between music and mood in participants that would most find this information useful. Because mood tracking is more personalized and determined to be more difficult to recruit for, we aimed for more musically interested people. Thus, we purposefully targeted users who historically have tracked their music listening through tools, such as Spotify and Last.fm, and more easily accessible users such as Columbia affiliated students. Recruitment consisted of posting ads through Last.fm related online forums (Reddit, Discord) and Columbia University affiliated platforms (Facebook groups, email). Out of 177 interested, 125 came from Reddit, 28 from Discord, and 9 from Facebook - 46 remained active participants till the end of the user study. Additionally, here is the gender (17 female, 21 male, 6 non-binary, 2 n/a), race (29 white, 12 Asian, 4 Hispanic/Latino, 1 black) and age (36 age 18-24, 10 age 25+) breakdown of the 46 participants.

To begin the study, participants were asked to fill out a pre-system survey to obtain their permission to document their music listening history via Last.fm and their mood via a survey sent out every day over the course of the 30 day study. This daily survey consisted of filling out the circumplex model of affect which aims to describe complex moods via an interdependent relationship between two main neurophysiological systems, valence and arousal. These two categories are simply mapped on a two linear axes from unpleasant to pleasant (valence) and deactivated to activated (arousal) to create four generalized quadrants of pleasant/activated (Q1), pleasant/deactivated (Q2), unpleasant/deactivated (Q3), and unpleasant/activated (Q4). A user will then plot a point on the circumplex model of affect that most aligns with their mood for that day, and write a few key words relating to their mood and day.


Figure 1. Users documented their mood using the cicumplex model of emotion with the x-axis representing the continuum of unpleasant to pleasant and the y-axis representing the continuum of deactivation to activation. We superimposed a smaller circle (radius=3) in order to create 8 sections to represent mood at more neutral vs. intense states. We colored each of the four quadrants in order to visually differentiate the different moods in our data visualization.


By gathering this data for 30 days, we are able to plot this data along with the user’s past music listening history on a timeline in order to see fluctuations in a specific user’s mood and music at the same time. At the end of the study, users took a post system survey where they investigated their personalized data visualization through MoodWaves, and were tested to see if patterns in mood relating to music could be identified, and if this identification was useful for self-reflection.

To build out this data visualization, we worked through an Observable Notebook with HTML, CSS, Javascript and D3.js.

Now, we will dive into the design iterations and implementations of the data visualization system, MoodWaves [Figure 1]. In brain-storming, the key components considered were 1) to visualize a user’s daily mood in a visual and easy to understand way, 2) to link a user’s daily music in an auditory way in order to enhance or evoke its respective mood for the day, and finally, 3) to showcase this information in chronological order. Through 3 different attempts showcased to non-participating users, we landed on a final first iteration which showcases music and mood over time in the formation of a colorful sound wave. This is to provide a marketable and aesthetic quality to the data visualization to encourage usage of a potentially long term self-reflection tool.

To build out this data visualization, we worked through an Observable Notebook with HTML, CSS, Javascript and D3.js. After a framework for the visualization was created, a shift to Github was made to serve the data visualization on a public web app, incorporate more interactive auditory elements, such as album covers and song previews, through Spotify API, and upload user data through JSON files.

As a user navigates through MoodWaves, they can see song quantities over time in a sound wave formation, color coded by a user’s documented mood - this color code consists of the 4 quadrants of the circumplex model of affect previously detailed, and each were further divided into two sections in order to show intensity of mood as well (more neutral emotions are lighter in color). By hovering over each bar, representative of a day, one can hear the top song played on that day and potentially enhance the self reflection process by incorporating directly documented mood with memory and emotion evoking auditory and visual stimulation. On the left is a legend as a reminder of what each of the 4 quadrants of the circumplex model of affect represent, and hovering over each color filters out that mood on the MoodWaves - this is to further emphasize patterns in mood in relation to music.

Data analysis

From here, users were given the link to the online web app, and could access their personalized MoodWaves using their Last.fm username. During the post-system survey, users navigated and explored their MoodWaves for approximately 5 minutes and answered questions relating to the usability of the data visualization (Was it easy to understand? Easy to use?), the noticability of mood/music patterns aided MoodWaves features (Did it increase your understanding of the relationship between mood and music?) and the contribution of this pattern recognizing for furthered self-reflection (Do you understand your emotional state more? Are you encouraged to self-reflect more?).

While the quantitative Likert scales showed factual favor for MoodWaves in representing mood with music effectively, it was in the short responses that repeating key concepts could be more specifically identified. By gathering all user quotes from the short answer response sections (What features did you like/find useful or disliked/did not find useful? Were any patterns identfied through MoodWaves? Did seeing these patterns reveal insights about yourself? Would you continue to use MoodWaves for active self-reflection?) through affinity mapping, we could more visually see patterns in user responses. It is interesting to see each user’s personal relationship with music and how they use the information discovered - this topic is discussed further in the following section.


Analyzing quantitative post-system survey responses from 47 participants

In this section, we discuss the key findings after analyzing thepost-system survey responses from 47 participants in which they reflected on their experience with using MoodWaves. Using affinitydiagramming, we examine the features users found most usefulin determining the relationship between their mood and musiclistening history. Additionally, we discuss our key finding that themajority of our users were able to notice pattern between their music and mood.


Figure 2. In the post-system survey, we asked our users to read several statements about their experience using MoodWaves,and decide how much they agree or disagree with the statement on a scale from Strongly Disagree, Disagree, Agree, andStrongly Agree. We have highlighted for each statement a white marker, to the right of which represents all users who agree with the statement.

System usability and key features

In the post-system survey, we asked our users to discuss the us-ability of MoodWaves, as well as the features they found mostinteresting. Overall, users found the system easy to use (80%, N=37)and understand (85%, N=39). We then used affinity diagramming todetermine the four key features users were interested in: filteringthe days by mood, using the colored circumplex model to showmood, displaying the top tracks per day, and the use of audio andautoplay for the top track when hovering over a day.


1. Filtering by mood

Interest in filtering by mood was the feature mentioned most consistently, with 9 participants mentioning it. Many participants were interested in filtering because it enabled them to more easily look for correlations and similarities between specific moods and music.

For example, P1 notes: “I like the idea of isolating specific moods and looking at only days that correspond to those feelings. It let you focus in to look for similarities.” Additionally,14 participants mentioned the overall visualization of mood paired with music in general was interesting. Thus, we conclude allowing users to filter their days by mood was an important factor that allowed users to see see patterns in their mood and music.


2. Colored circumplex model for mood

Participants also were interested in using the flexible, circumflex model for emotion to document their mood, and found the colored quadrants helpful in associating their moods to the visualization. 6 participants mentioned the colored circumflex model, discussing both the benefits of having a non-linear model for mood as well as the benefits of adding color to the model to see the different moods visually.

For example, P2 writes about the benefits of having a more flexible, non-linear model: “it didn’t have very well defined extremes, so if you weren’t feeling completely one thing you could put the “middle ground.” While this model was highlighted as a feature many participants liked, 6 participants also commented on possible suggestions for this model such as adding more keyword emotions for each quadrant or taking more time to explain the model since several users had trouble understanding it.


3. Displaying top tracks

6 participants mentioned that seeing the top songs section for each day was helpful since it helped users better remember their mood on a specific day, and generally see trends on when they listened to the same songs. P3 writes “Top songs shown for each day rather than top songs per week or per month clumped together, helps me pinpoint exactly what mood I was feeling that day.” In comparison to seeing top songs on a weekly or monthly basis, P3 found it easier to pinpoint specific daily moods based seeing the top tracks for each day. Thus, we conclude reflecting on specific songs can assist in self-reflection by enabling users to more easily pinpoint their mood on a specific day.

Recognizing patterns in music and mood

Our key finding is that 66% of users were able to see patterns in theirmusic listening history and mood using MoodWaves. By visually depicting this relationship, our system has enabled the majority of our participants to better understand the relationship betweentheir music and mood. By helping users recognizing patterns inmusic and mood, our system ultimately assists them in the self-reflection of how their music impacts their mood, and vice versa. Since participants’ relationship with their music and mood are very personal, they all noticed different patterns. We classified some of these patterns using affinity diagramming, and discuss three key patterns: the relationship between type of music and mood, the relationship between amount of music and mood, and the interde-pendent relationship between mood and music.


Relationship between type of music and mood

“I like to relate the type of music I listen to with my mood, thoughts and activities. On days where I feel down, I tend to either listen to “moody” music.”

Participants noticed that they listened to certain types of music, such as genre or mood, when they felt specific moods. For example, participant P4 would listen to “moody” music or happy music when they felt down, which gave them a better understanding of their relationship between mood and music: “Noticing these patterns give me a better idea of my relationship with music. To me, listening to music is an important part of my life. I like to relate the type of music I listen to with my mood, thoughts and activities. On days where I feel down, I tend to either listen to “moody” music, or music that makes me happy. However, on days where I feel content/happy, I tends to explore music or listen to my favorite playlists.” Additionally, P4 noticed that they not only related their music with mood, but also with thoughts and activities, suggesting the possibility of using music as a form of self-reflection on more than simply mood.


Relationship between amount of music and mood

“I realize that when I’m in one of my anxious, overthinking, stressed or sad moods, music can be overwhelming for me.”

Participants (N=7) also noticed a relationship between the amount of music they listened to based on their mood. For example, P5 noticed that they would listen to less music when they were anxious or stressed, which they were previously unaware of: “The connection between the amount of music and the mood became more clear to me. I realize that when I’m in one of my anxious, overthinking, stressed or sad moods, music can be overwhelming for me.” In fact, several participants (N=4) mentioned that they would listen to less music when they were feeling anxious or stressed, suggesting the possibility ofu sing music and mood to bring awareness to mental health patterns.


Interdependent relationship between music and mood

“I noticed either my mood impacts my music choices, or my music choices impact my mood. . . I’m not really sure which is which.”

We also found that there is an interdependent relationship between music and mood, although it is unclear which it the cause of the other. For instance, P6 writes: “I noticed either my mood impacts my music choices, or my music choices impact my mood. . . I’m not really sure which is which.” While P6 noticed an interdependent relationship between the two, more study needs to be done to understand the casual relationship between the two.

Future steps

We designed MoodWaves to create a visual understanding of the relationship between music listening history and mood in order to support self-reflection. Our 47 participants documented their mood using a circumplex model for emotion for 30 days before they were presented with a visualization of their mood and music. Results show a preference towards four key features that helped users notice patterns in their mood and music: filtering the days by mood, using the colored circumplex model to show mood, displaying the top tracks per day, and the use of audio and autoplay for the top track when hovering over a day. We also found that using our system, the majority of our users were able to notice patterns between their music and mood, suggesting the possibility of using our system to assist users in self-reflection and better understanding this relationship.

These findings suggest new opportunities for investigating how users may benefit from understanding these long-term patterns in mood and music, especially in the form of (1) passive self-reflection and (2) understanding mental health patterns. We see future applications of using music as a passive form of self-reflection by either labeling historical listening history with mood or predicting future moods using past listening history. Additionally, since music and mood have been shown to be linked to mental health, we see an opportunity for better understanding these patterns and suggesting strategies to assist users. We hope this research provides another step in the HCI community to how we can use subjective sources of data such as music listening history and mood in order to better reflect on and understand personal human behavior.